Why an organisational carbon footprint screening?
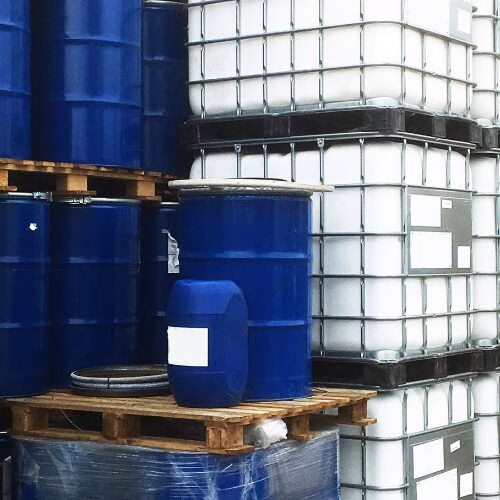
SABA is a Dutch adhesive and sealant producer who sell their innovative products to various industries globally. SABA is actively working on sustainability and asked Ecomatters to perform a carbon footprint screening for their full product portfolio.
An organisational carbon footprint is essentially a calculation of the total yearly climate change impact (expressed in kg CO2-equivalent) resulting from the greenhouse gasses (GHG) that are emitted by the activities across the entire value chain of an organisation.
The organisational carbon footprint calculation enables SABA to understand their organisation’s baseline-line emissions and use this baseline as a starting point for tracking their sustainability performance. An organisational carbon footprint screening is especially relevant for organisations that have a large product portfolio and want to:
- Identify where to focus efforts to effectively reduce overall climate change impact;
- Set impact reduction targets and measure progress towards these targets.
How was the organisational carbon footprint screening conducted?
Since the organisational carbon footprint is based on the emissions from the organisation and its value chain, the first step is to gain insight into which activities are needed to produce SABA’s products. SABA offers a wide range of adhesive and sealant products, each with its own specialised characteristics. Therefore, the organisational carbon footprint screening was streamlined by grouping SABA’s product portfolio into 10 product groups.
The scope was set from cradle to gate. In other words, the carbon footprint screening includes all the impacts from the extraction of raw material inputs up until SABA’s factory gates where the packaged products are ready for shipment. Eventually, this resulted in the calculation of the total impact categorised into 7 different parts of the production process:
To facilitate smooth data collection by SABA, Ecomatters provided a data template and supported SABA during the data collection process. The data collection approach was tailored to the format in which the data was logically accessible. For example, product-specific data (such as required raw materials) was provided in detail and separately for each of the 10 product groups. Whereas facility-specific data (such as electricity use, gas use, and waste) was provided for the whole production facility, and afterwards allocated to the different product groups.
After completion of the data collection and processing, the organisational carbon footprint was determined. This was done by calculating the cumulative impacts from the 10 product groups, taking into account the annual production volumes. In this way, SABA gained insight into the impact contribution of each product group toward the total organisational carbon footprint.
What insights did SABA gain from the carbon footprint screening?
If the yearly production volume in a given product group increases, it is not surprising that the carbon footprint increases alongside it. After all, each additional kilogram of product manufactured requires additional materials, packaging, energy use, transport, and other inputs that cause additional impact accordingly. Due to this relationship between production volume and total impact, the organisational carbon footprint is not the best metric to compare the relative sustainability performance of the product groups it is composed of.
For this reason, Ecomatters also calculated the so-called “carbon intensity” for each of the 10 product groups. This is essentially the carbon footprint of 1kg of product, calculated by dividing the total carbon footprint of a product category by its yearly production volume in kg. By taking the production volume out of the equation, SABA is provided with a fair comparison of the climate performance of each product group. These carbon intensities show which products in SABA’s portfolio are most sustainable, enabling SABA to optimise their sustainability & marketing strategy.
Additionally, Ecomatters performed a hotspot analysis for each of the 10 product groups, by calculating the contribution from the 7 different parts of the production process to the total impact of the respective product group. On top of this, for each product group, Ecomatters analysed which 5 materials caused the majority of the impact from raw material sourcing. The hotspot analysis showed that there are significant differences between the impact from production processes, enabling SABA to effectively target impact hotspots.
Below is a testimonial quote by SABA about our collaboration:
“As global leader of sealants and foam bonding adhesives, we have committed ourselves to lower our carbon footprint. It took a lot of effort to collect all necessary data, but the smooth collaboration with Ecomatters, their expert knowledge and easy-to-work-with template made the report very valuable for us.”
Chris Belterman, Product Marketing Manager, SABA